
Greening Our City Grant Program
Online Interactive Spatial Prioritisation Tool User Guide
The Online Interactive Spatial Prioritisation Tool (or simply the Online Spatial Tool) is designed to provide relevant datasets to support the selection and justification of tree planting sites and strategies. The purpose of this user guide is to provide the necessary guidance and instructions on how the Online Spatial Tool can be used to help you prepare your grant application. It is not intended to be a comprehensive user manual for all the functions of the Online Spatial Tool. The scope of this user guide is limited to the functions of the Online Spatial Tool that are essential to the grant application.
|
|
4.1 Can I save my work progress and resume in another session?
4.2 Can I import my own GIS files or upload my own datasets into the Online Spatial Tool?
4.3 How to find a location on the map?
4.4 How do I change the basemap?
4.5 Can I add labels to my map?
4.6 Can I edit my labels on the map?
4.7 Can I edit my drawings on the map?
4.8 How do I export drawings of my proposed sites as shapefile?
4.9 How do I export map, together with labels and annotations?
4.11 What if my proposed site has multiple data ranges?
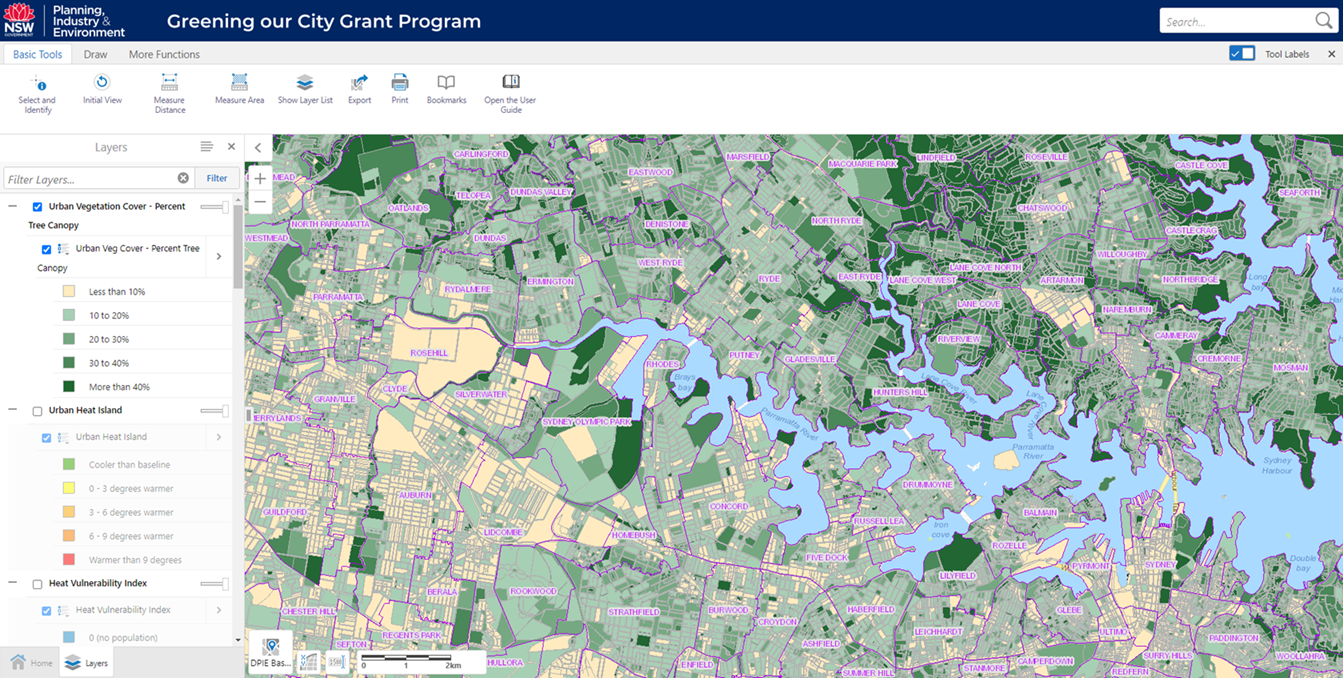
The purpose of this Online Spatial Tool is to inform site selection decisions relating to tree planting based on needs and potential benefits. The Online Spatial Tool enables the relationships between environmental, health and socio-economic factors to be visualised and considered in context of each other. By adjusting the transparency levels of the various overlaying data layers, the Online Spatial Tool provides the capacity to view and explore the relationships between the different datasets. The drawing, labelling and editing functions can be used to mark out areas of interest, which can then be exported as shapefiles, or as annotated maps.
The Online Spatial Tool is compatible with Google Chrome, Internet Explorer and Mozilla Firefox.
Move - click and hold down the left mouse button to move the map in any direction.
Zoom in - Roll the scroll wheel on the mouse forward (or away from you).
Zoom out - Roll the scroll wheel on the mouse backward (or towards you).
|
|
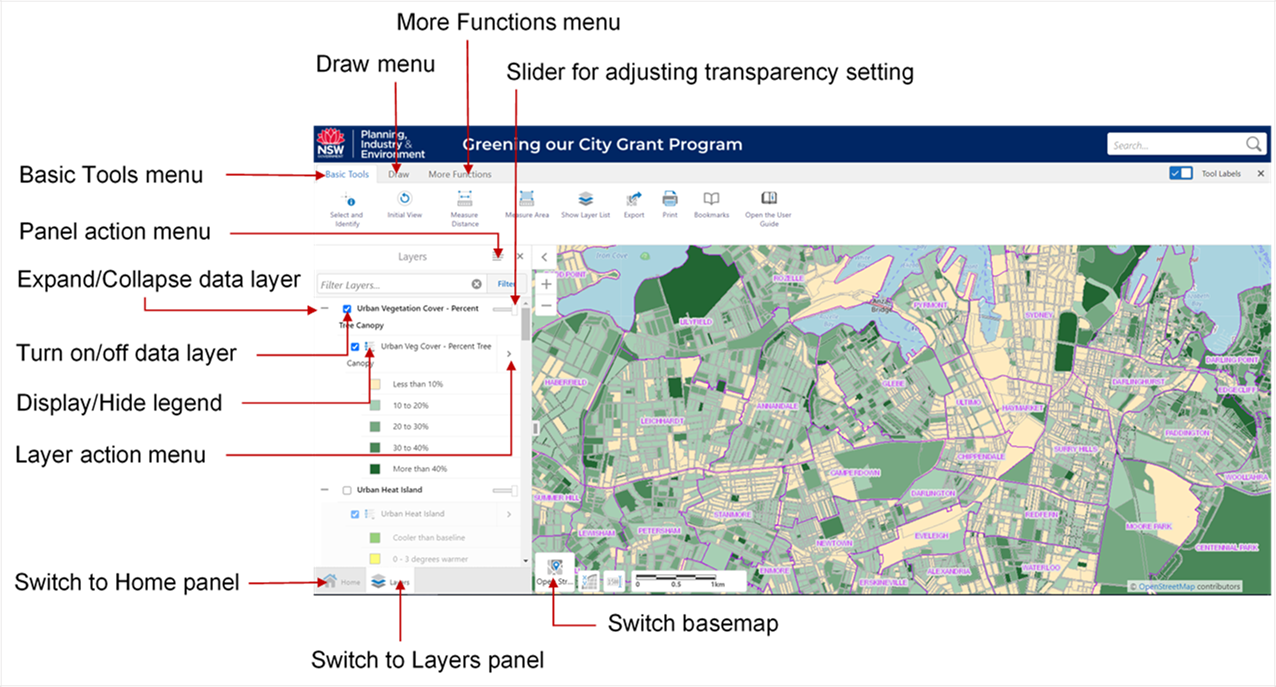
The tabs in horizontal panel at the bottom left corner of the screen are indicative of the viewing panels that are currently open. Only one panel can be viewed (active) at any given time, and the tab will be lit up. The tabs of inactive panels are greyed out. In the example above, the Layers panel is active, and the contents of the panel are visible. The Home panel is the only other panel that is open but inactive. Its tab is greyed out and its contents are not on display.
New panels will open as you use the different functions, and all the relevant information, options or results will be displayed in the panel window. You can switch between the different panels at any time by clicking on the tab of the panel that you wish to view. In some instances, the panel displays will open and stack on top of each other so you may need to close the panel(s) on top first in order to view the panel underneath.
Home Panel
The Home panel is the default active panel whenever the Online Spatial Tool is launched. It provides background information about the Greening Our City Grant Program which this Online Spatial Tool is intended to support.
Layers Panel
The Layers panel is the most important panel. It is where you interact with all the relevant datasets that have been provided to assist with the spatial prioritisation questions by selectively turning on/off the different data layers. If you closed this panel by mistake, you can bring it back at any time by clicking the ‘Show Layer List’ button in the Basic Tools menu.
The
Panel action menu ![]() provides a list of actions
that are only applicable to the active panel. Each panel (except Home) has its
own Panel action menu. For example, the Panel action menu for the Layers
panel contains the following options:
provides a list of actions
that are only applicable to the active panel. Each panel (except Home) has its
own Panel action menu. For example, the Panel action menu for the Layers
panel contains the following options:
Show Legend – this will show the legend for all active data layers in the panel display. However, you will not be able to use the transparency slider to adjust the transparency level if the legend information is displayed this way.
Change Layer Drawing Order - this allows you to rearrange the order in which the visible data layers are stacked and displayed on the map.
The
Layer action menu ![]() provides
a list of actions that are specific to the corresponding data layer and
contains the following options:
provides
a list of actions that are specific to the corresponding data layer and
contains the following options:
Zoom to full extent – the map will be displayed at a scale that shows the full spatial extent of the dataset.
Zoom to visible scale – the map will zoom in to the coarsest possible spatial scale at which the information of the dataset can be viewed.
Layer Information and Download – opens the info sheet of the dataset which also contains the link to the data portal from which the dataset can be downloaded.
The
Display/Hide Legend icon ![]() for each data layer allows
you to display or hide the legend information for that data set.
for each data layer allows
you to display or hide the legend information for that data set.
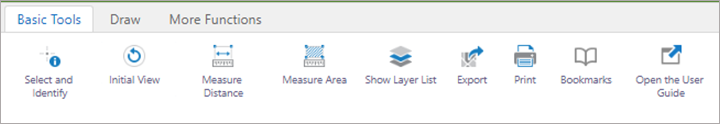
The Basic Tools menu contains a set of general functions.
Select and Identify
This function is used to identify any selectable features on the map. To enable this function, click on the ‘Select and Identify’ button. The button will be highlighted in blue to indicate this function is active. When active, move the mouse cursor and click on any point on the map and to generate a list of itemised search results of all the visible data layers in a newly opened ‘Identify Results’ panel. Click to see the available data that are relevant to the point (including the feature containing the point) that you have selected. Unlike most of the functions in this tool, the ‘Identify’ function does not remain active, and needs to be selected (activated) each time.
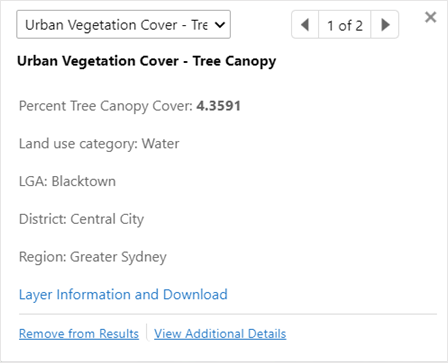
The ‘Select’ function is always active and is the default function whenever you use your mouse to click on any selectable features. It is the simplest way to extract available information. When a selectable feature is selected, a properties window will appear. This properties window will display the data of the selected feature, as well as any other related features from other visible data layers. You can use the dropdown menu in the properties window to select the specific data layer you wish to see if it is not the first page displayed.
If the selected feature is from one of the data layers, the properties window will display all the key attributes and provide the option to access additional information relating to the dataset. Clicking on ‘Layer Information and Download’ will open a summarised info sheet for that dataset which also contains the link to the data portal from which the dataset can be downloaded.
If the selected feature is one of your drawings (including labels), the properties window will provide the option to customise your drawing (using the ‘Styles’ option) or delete your drawing (using the ‘Delete’ option).
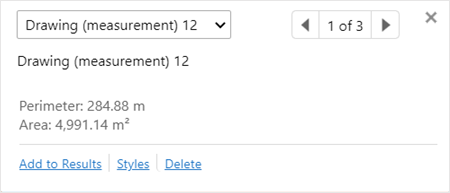
If the selected feature is a measurement display from using the Measure Area function, the properties window will provide the option to customise your measurement display (using the ‘Styles’ option) or delete your drawing (using the ‘Delete’ option).
Initial View
Change map view to the initial default start-up extent, at 1:577791 map scale, which depending on the size of your screen, is the approximate extent of the Greater Sydney Region. Some data layers contain details that are displayed at a much finer spatial scale and will not be visible when viewed at this scale.
Measure Distance
Calculates the distance of a straight line, or the distance of a multi-part line that you have drawn. The output is displayed as a label.
Measure Area
Measures the area and the perimeter of any shape you draw. The output is displayed as a label.
Show Layer List
Unhides the Layers panel if it is hidden or closed.
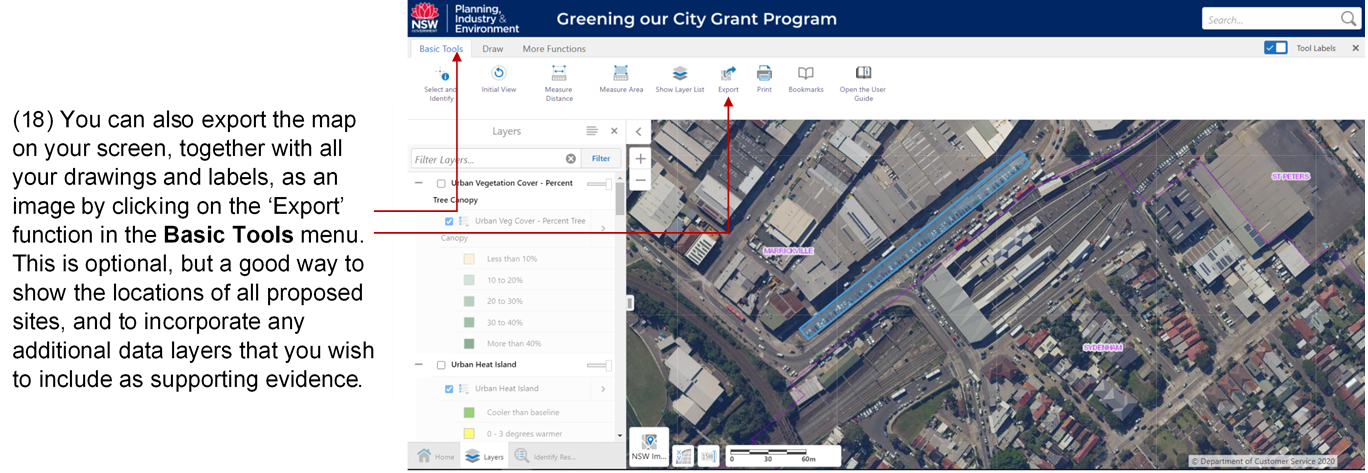
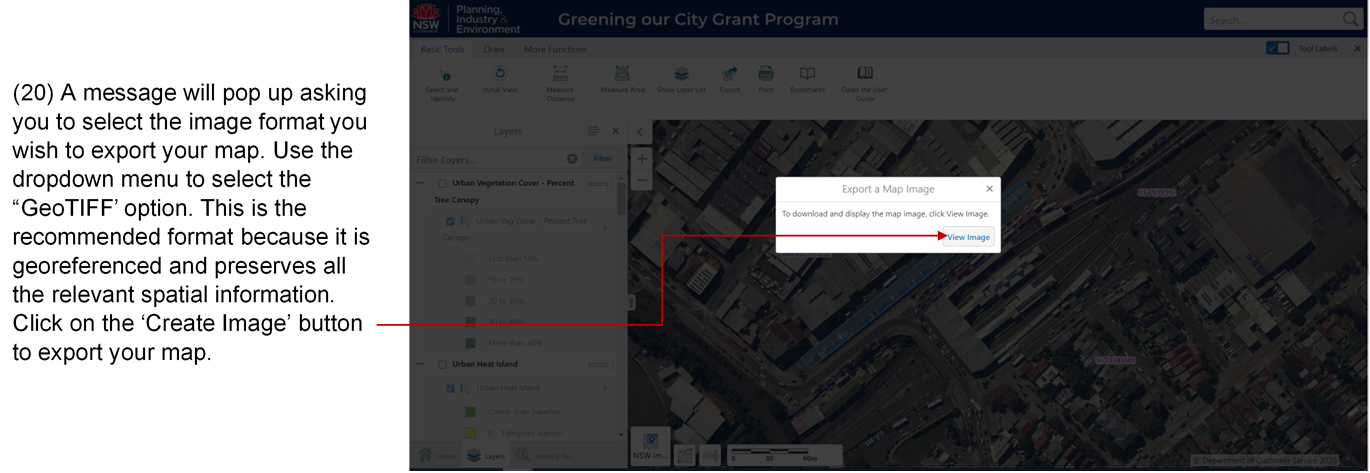
This will allow you to export the on-screen map (including all on-screen features and annotations) as an image in a selection of formats (BMP, JPEG, PNG, TIFF, GeoTIFF, PDF). GeoTIFF is the recommended format for an exported map, because it is georeferenced and preserves all relevant spatial information. For all the other image formats, it is important that the exported map includes the relevant georeference data (by ticking the ‘Include Georeference Data’ box), so that all the essential spatial information are captured and the map can be displayed in the correct spatial orientation when viewed at a later date using any GIS software.
Creates a printable pdf version of a map with title, legend and any accompanying notes.
Allows you to save your current viewing extent which you can return to at anytime. The bookmarks are saved on your computer and can be retrieved and used in any subsequent or new sessions.
Open the User Guide
Opens this User Guide in a separate web browser window.
The
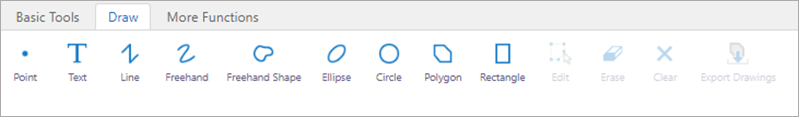
Draw menu provides a range of drawing options. Select a drawing function
by clicking on the corresponding icon. When selected, the icon will be
highlighted in blue. For example, when the ‘Text’ function is selected by
clicking on it, the ‘Text’ icon will light up in blue ![]() to
indicate it is active. It will remain active until deactivated by clicking on
the icon again.
to
indicate it is active. It will remain active until deactivated by clicking on
the icon again.
Point
Adds a point on the map. Move your mouse cursor to the position where you wish the point to be added and left click.
Text
Adds customised text, which can be used to label or annotate the map. This is functionally equivalent to the “Add Some Text” option when you right click your mouse.
Line
Draws a straight line or the straight segments of a continuous line on the map. Double left click on completion. You can hit the Esc key at anytime before you double click the mouse to cancel any incomplete drawing.
Freehand
Draws a free-form continuous line on the map. Left click and hold to draw as the cursor moves. Drawing is completed as soon as you release the mouse button. You can hit the Esc key at anytime before left mouse click is released to cancel any incomplete drawing.
Freehand Shape
Draws free-form shape. Left click and hold, then drag the mouse to draw as the cursor moves. Drawing is completed as soon as you release the mouse button. You can hit the Esc key at anytime before left mouse click is released to cancel any incomplete drawing.
Ellipse
Draws an ellipse on the map. Position the cursor at the point where you want the centre of the ellipse to be. Left click and hold and then drag the mouse to draw. Drawing is completed as soon as you release the mouse button. You can hit the Esc key at anytime before left mouse click is released to cancel any incomplete drawing.
Circle
Draws a circle on the map. Position the cursor at the point where you want the centre of the circle to be. Left click and hold and then drag the mouse to draw. Drawing is completed as soon as you release the mouse button. You can hit the Esc key before you release the left mouse click to cancel any incomplete drawing.
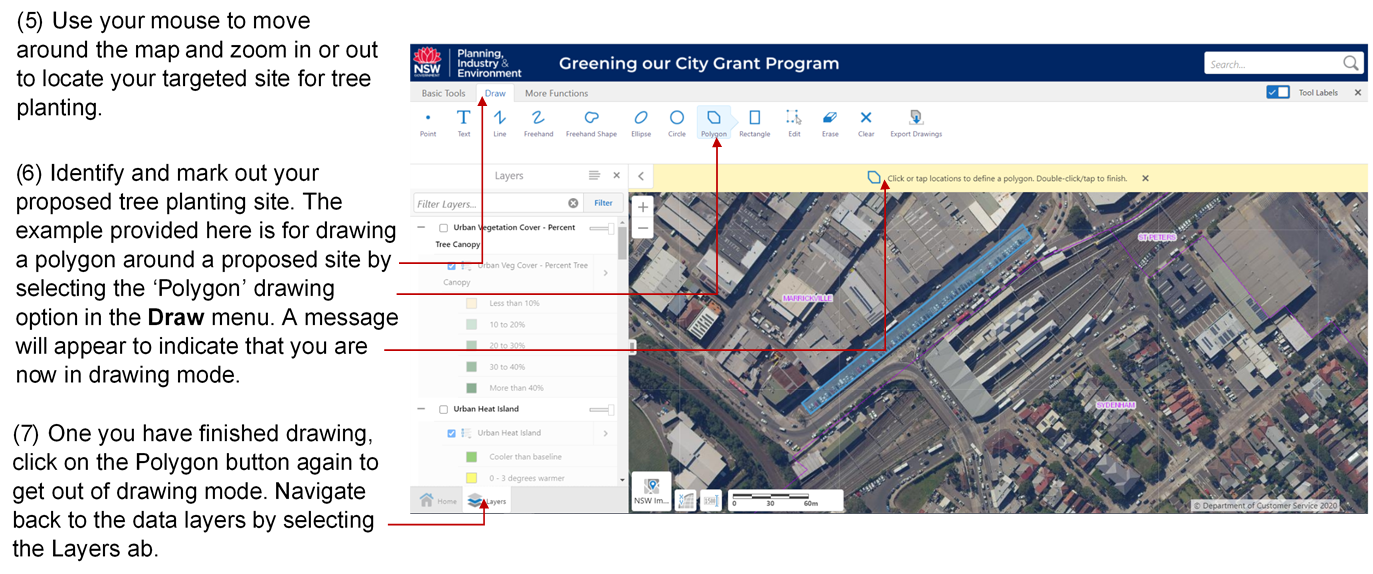
Polygon
Draws a polygon on the map. Each left click of the mouse represents a point of the polygon you are drawing. Double click on the last point to complete the drawing. You can hit the ‘Esc’ key at any time before you double click the mouse to cancel any incomplete drawing.
Rectangle
Draws a rectangle on the map. Left click and hold and then drag the mouse to draw your rectangle. Drawing is completed as soon as you release the mouse button. You can hit the Esc key at anytime before left mouse click is released to cancel any incomplete drawing.
Edit
Edits the size, position or orientation of any of your existing drawings.
Erase
Deletes any of your existing drawing that you on the map. Deleted drawings cannot be recovered. Drawing can only be deleted one at a time. If you wish to delete all of your drawings at once, then use the Clear function.
Clear
Deletes all drawings on the map and cannot be undone. DO NOT use this function unless it is your intention to delete everything you have drawn in your current session. To delete one or more drawings, use the Erase function to delete them individually.
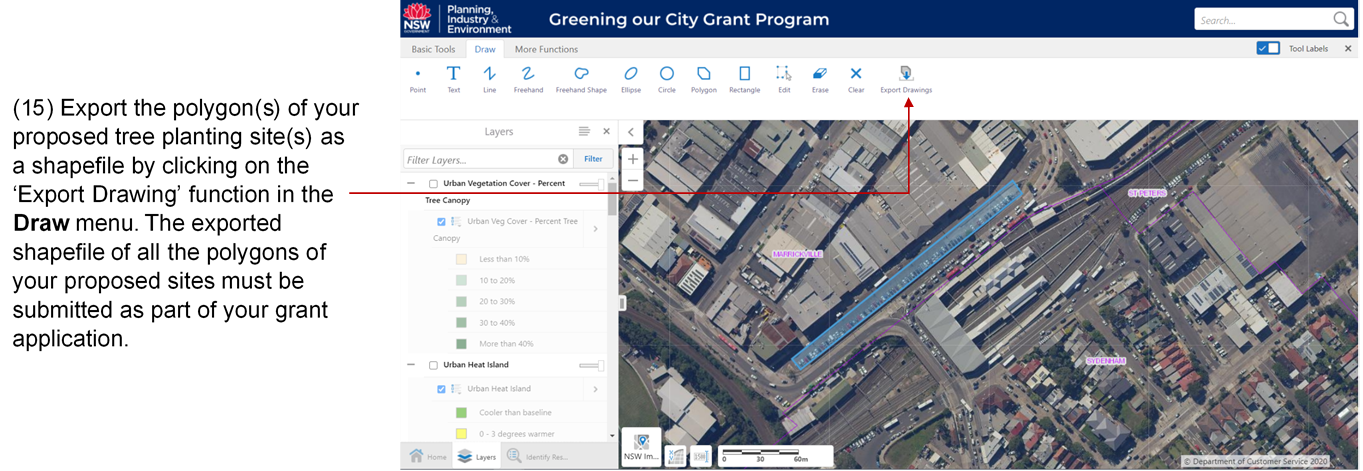
Export Drawings
Exports all of the points, lines or polygons that you have drawn on the map in your current session as a shapefile. Any text that you have added as labels cannot be exported as a shapefile, but they are retained when the map is exported (using the Export function in the Basic Tools menu).
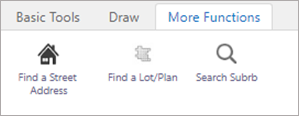
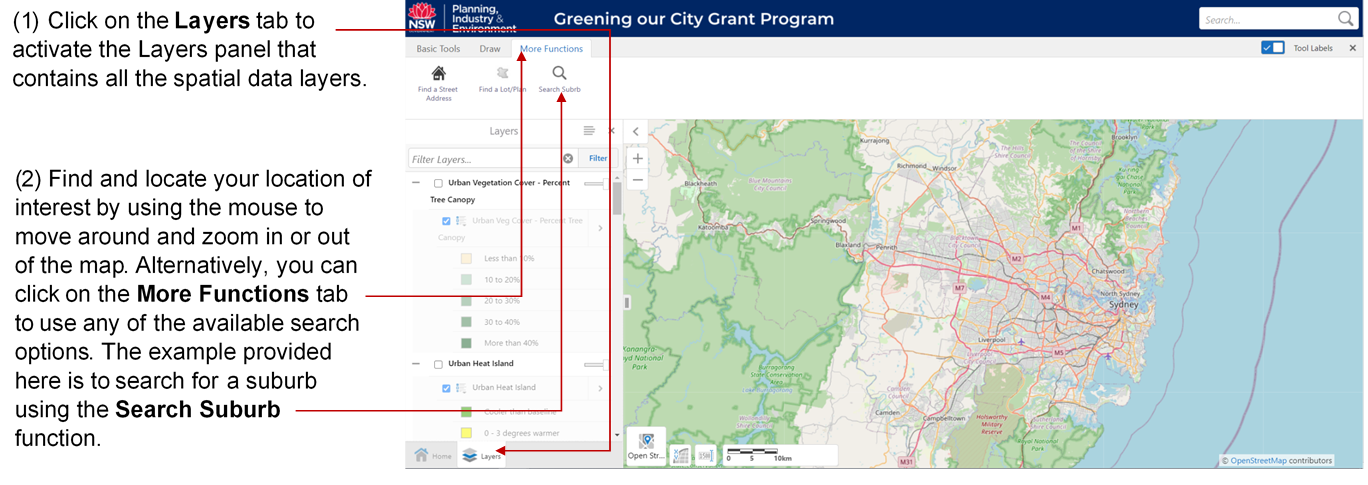
The More Functions menu provides the search options for finding the location of interest.
Find a Street Address
Locates a street address. Required input: Suburb, street name, and street number
Find a Lot/Plan
Locates a land parcel. Required input: DP or SP number
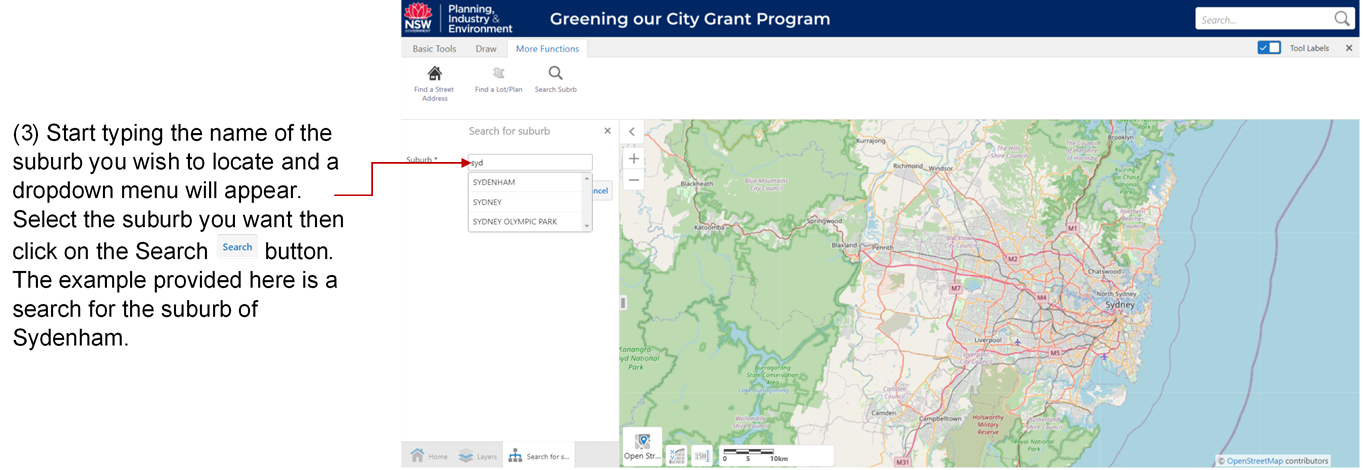
Search Suburb
Locates a specified suburb
3. How the Online Tool can be used to answer the spatial information questions in your grant application
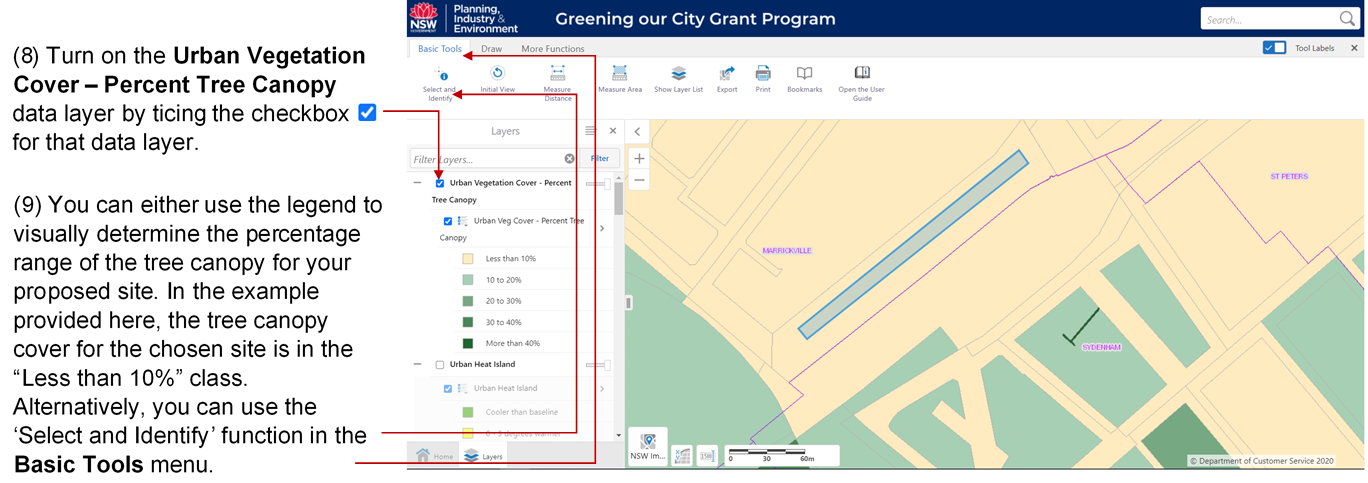
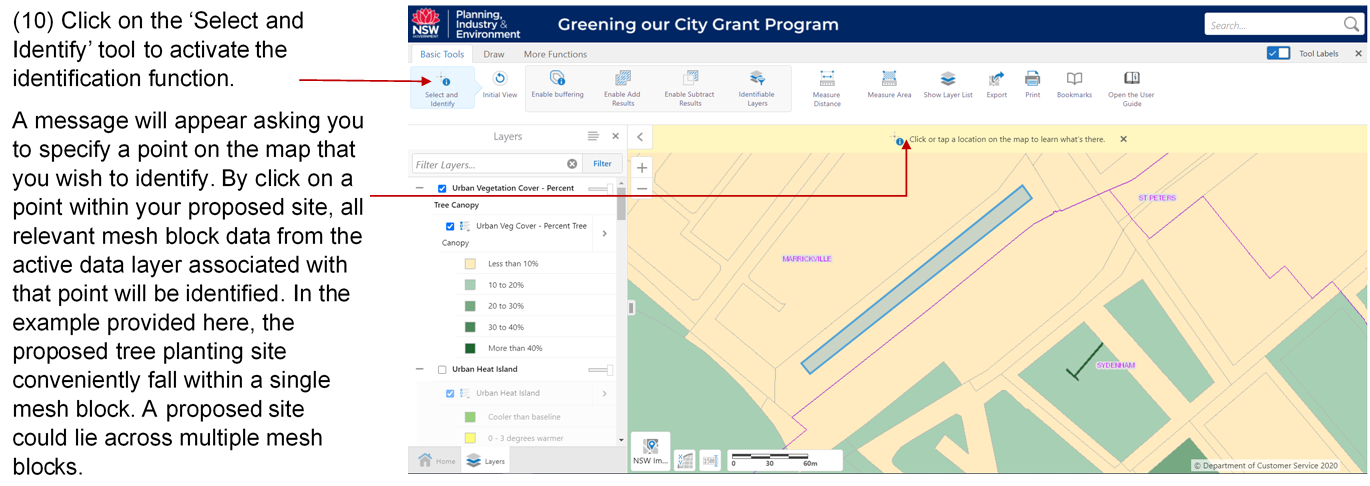
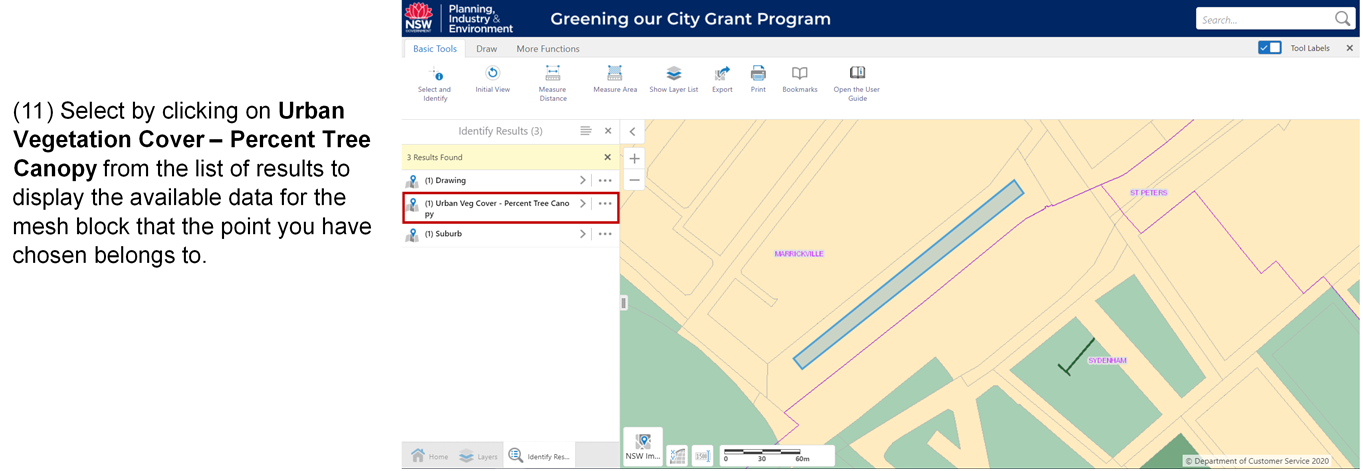
This example demonstrates how to use the online tool to answer question two (2) “Select the percentage tree canopy cover that applies to the tree planting site(s) of the project” on the application form. The same steps can be followed to answer similar questions relating to Urban Heat Island (question 3), Heat Vulnerability (question 4), and Soil Infiltration (question 5).
|
|
|
|
|
|
|
|
|
|
|
|
|
|
|
|
|
|
|
|
|
|
|
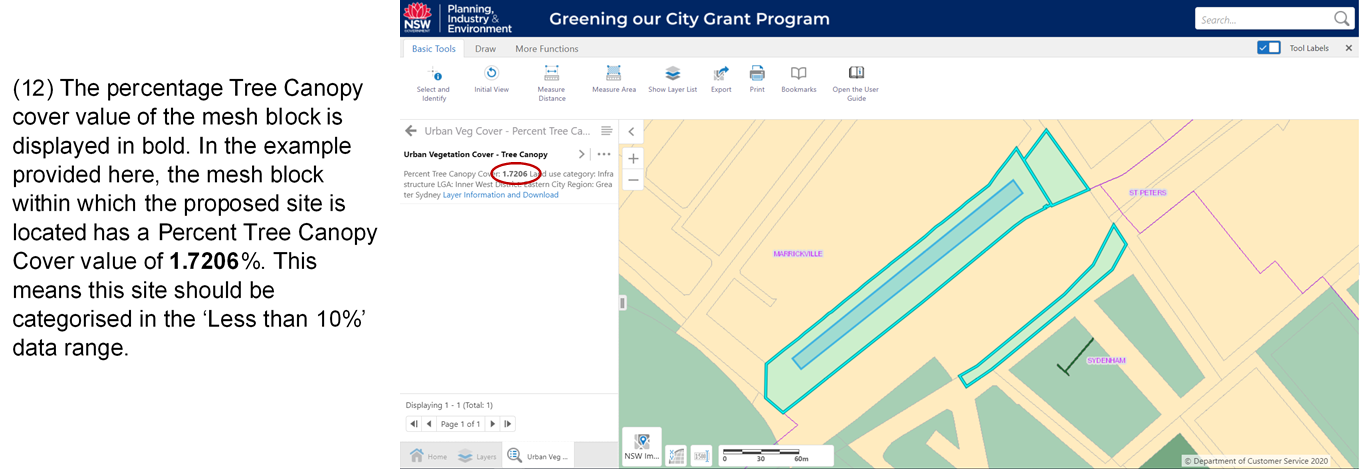
Note: If your proposed site encloses multiple mesh blocks then choose the mesh block that accounts for the majority of your site. If the most prominent mesh block cannot be easily determined choose the mesh block that best supports your proposal.
|
|
|
|
|
|
|
|
|
(13) Use the same polygon to answer the subsequent questions relating to Urban Heat Island, Heat Vulnerability, and Soil Infiltration.
· To answer question three (3) “What is the Urban Heat Island (UHI) reference/s for the project site/s”, repeat Steps 8 to 12 using the Urban Heat Island dataset. Turn off all other overlaying data layers.
· To answer question four (4) “Identify the Heat Vulnerability Index for the project site/s using the Vulnerability Scores below.”, repeat Steps 8 to 12 using the Heat Vulnerability Index dataset. Turn off all other overlaying data layers.
· To answer question five (5) “What is the soil infiltration rate/s (Hydrological Soil Group) of the project site/s”, repeat Steps 8 to 12 using the Hydrologic Groups of Soils in NSW dataset. Turn off all other overlaying data layers.
(14) If you are proposing multiple tree planting sites, then you will need to repeat Steps 1 to 14 for each new site. It is recommended that you label your sites (using the ‘Text’ option under the Draw menu) and utilise the bookmark function to help keep track of all the polygons that you may have drawn. Do not delete polygons once you have completed an assessment. You will need to export all of them at the end.
|
|
|
|
|
|
|
|
|
|
NOTE: While shapefile(s) of your proposed sites need to be exported and submitted as part of your grant application, it is not necessary to export the polygon for each individual site separately. You can export all your polygons together at the very end as a single shapefile. The ‘Export Drawings’ function will export ALL existing drawings (which may be polygons, lines, and/or points) from your current session. If you intend to use the Online Spatial Tools over multiple sessions to complete your grant application, make sure you complete all relevant tasks, answer all relevant questions and export the polygon(s) of your proposed tree planting site(s) before ending your session and closing the Online Spatial Tool. Any incomplete work from a previous session are not retained and cannot be recovered (See FAQ 4.1). Remember to submit the exported shapefiles from all sessions.
|
|
|
|
|
|
|
|
|
|
|
|
|
|

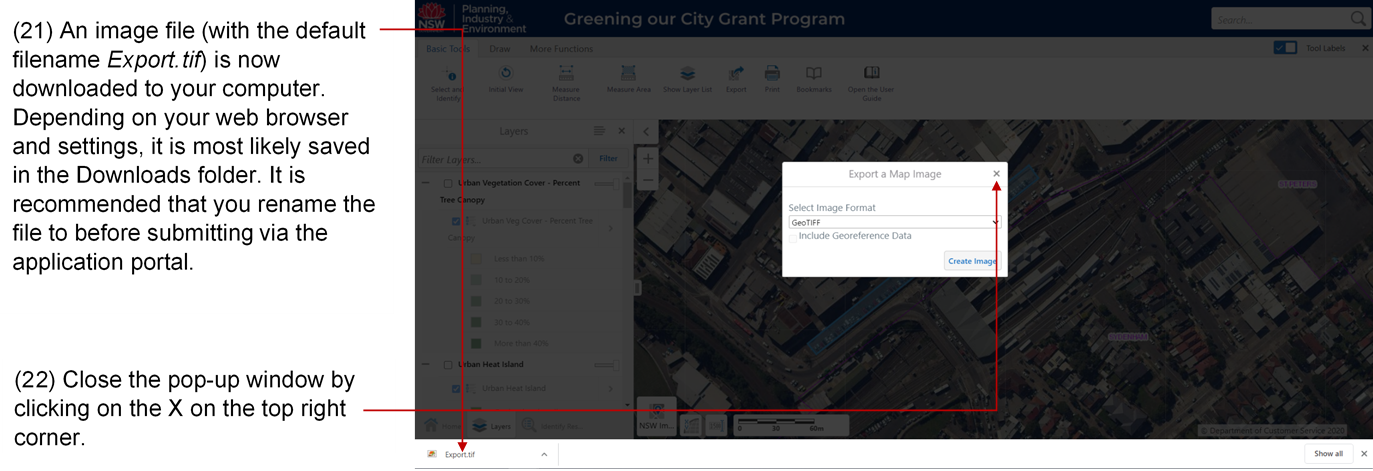
(23) Repeat Steps 18 to 20 for any additional maps you wish to export and include as part of your grant application.
This case study demonstrates how the data layers in the Online Spatial Tool can be used to help explain the reasons why a proposed tree planting site was chosen.
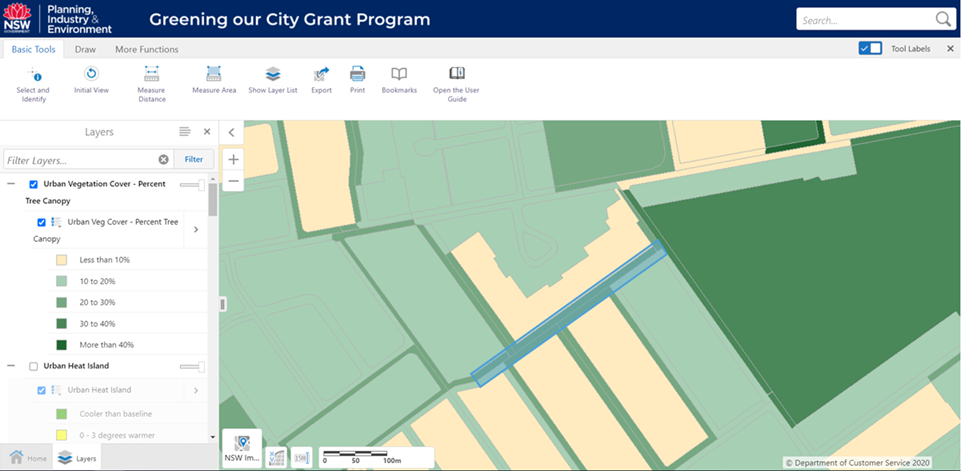
In this hypothetical scenario, the proposed project is to plant native trees along the median strips of the wider suburban streets and roadways to complement existing trees in nearby parks and along footpaths. The objective of the project is to improve the quantity and quality of trees within the council areas that will generate a range of environmental and recreational benefits that underpin the Council’s commitment to promote sustainable, healthier, greener living in suburbs with high densities of buildings and growing populations. The proposed tree planting is expected to contribute to the environment target of increasing the existing suburban tree canopy cover by 40%. By planting trees in the centre of roadways, it is possible to strategically position them away from powerlines, which allows the long term expansion of tree canopy cover and the ongoing capacity to provide shade. The examples below show how the various data layers can be used to justify or support the selection of the proposed tree planting site (indicated by the polygon with blue outline).
|
The % tree canopy cover in the proposed site is predominantly within the 20-30% range, with a minimum of 12% and a maximum of 25%. The proposed tree planting in the proposed site is expected to increase existing tree canopy by up to 50%. |
|
|
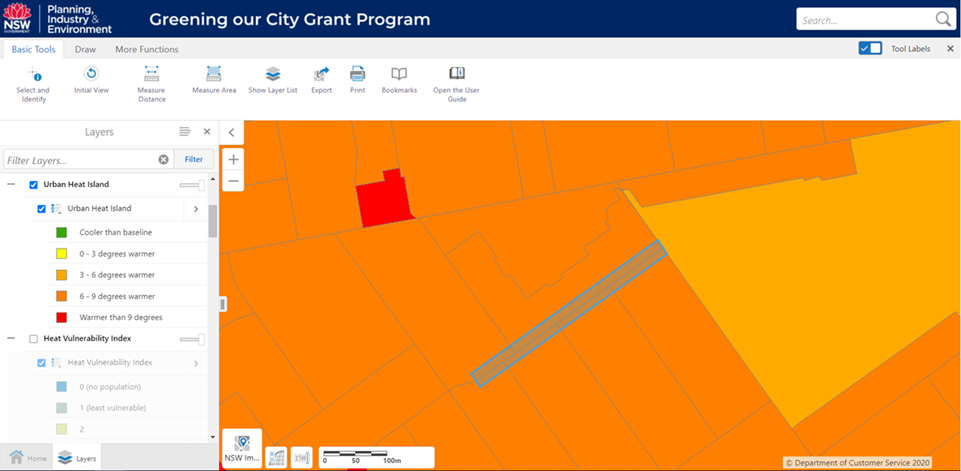
The proposed site is subject to the effect of Urban Heat Island in the magnitude of 6 to 9 degrees warmer. The proposed tree planting is highly desirable and is expected to help mitigate the impact of urban heat islands. |
|
|
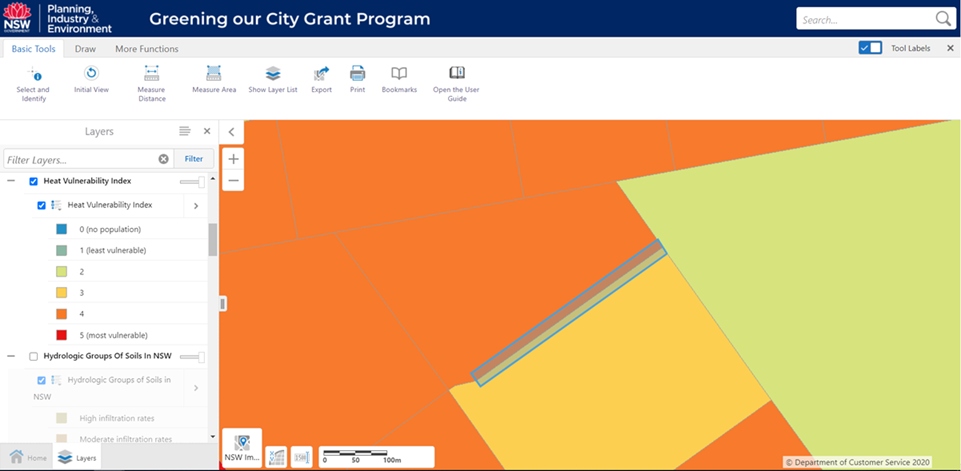
The proposed site is considered to be an area with relatively high vulnerability to heat. One half of the proposed site has a Heat Vulnerability Index score of 4, while the other half has a score of 3. Increased shading provided by increased tree canopy cover is expected to generate environmental, recreational and health benefits. |
|
|
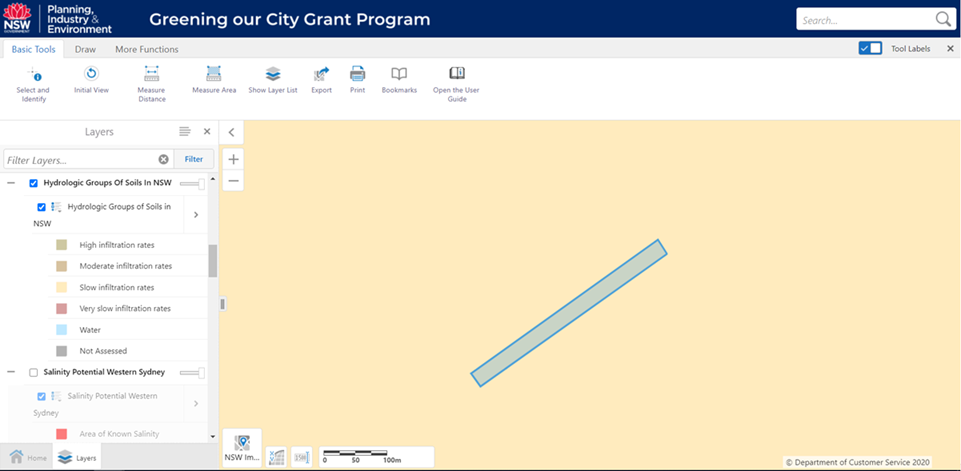
The soils in the proposed site have slow infiltration rates. Increased canopy from the proposed tree planting can increase the capacity to intercept rain and therefore reduce the volume and impact of stormwater runoff. |
|
|
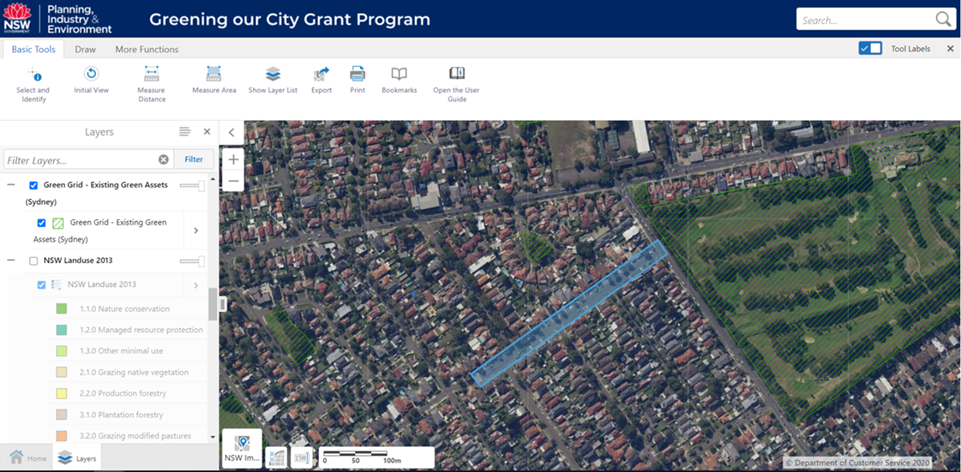
The proposed site is in the vicinity of other existing green assets, most notably a golf course with trees around its perimeter. The proposed tree planting can create a corridor of street trees which when connected with other nearby green assets, can contribute to an expanding network of urban shade, which has the added benefit of slowing down traffic in local streets and therefore improve pedestrian safety. |
|
The Online Spatial Tool also provides the option to annotate (use the Text function under the Draw menu) and export (use the Export function in the Basic Tools menu) your on-screen map as an image (in BMP, JPEG, PNG, TIFF, GeoTIFF or PDF format), which can be used to provide the justification and/or evidence base for this question. These are covered in the General Features section of the user guide.
4. Frequently Asked Questions
4.1 Can I save my work progress and resume in another session?
No, it is not possible to save incomplete work in your current session and resume at another time. Any existing work will not be lost unless you close the Online Spatial Tool or restart the Online Spatial Tool by refreshing your browser window. Starting another Online Spatial Tool in a new browser window means you are starting a new session, and any of the previous work completed using the other Online Spatial Tool are not retained or transferred. Saved bookmarks of mapview extents are retained and will still be available in any subsequent or new session(s).
4.2 Can I import my own GIS files or upload my own datasets into the Online Spatial Tool?
No, it is not possible to import your own GIS files (or any shapefiles previously exported from the Online Spatial Tool) or upload your own datasets. The Online Spatial Tool has functions that allow you to draw, edit or label your own features, which can be exported as shapefiles that are compatible with any GIS software. You can only use any of the datasets provided in the Online Spatial Tool by turning on/off the relevant data layers.
4.3 How to find a location on the map?
There are several ways to find the location you want on the map:
· Use the mouse (click and drag) to move around the map to find the location of interest, and then zoom in or out using the scroll wheel of the mouse. See also General Navigation, or
· Use the Search Suburb function in the More Functions menu to locate the suburb of interest, or
· Use the Search Street Address function in the More Functions menu to find a specific address
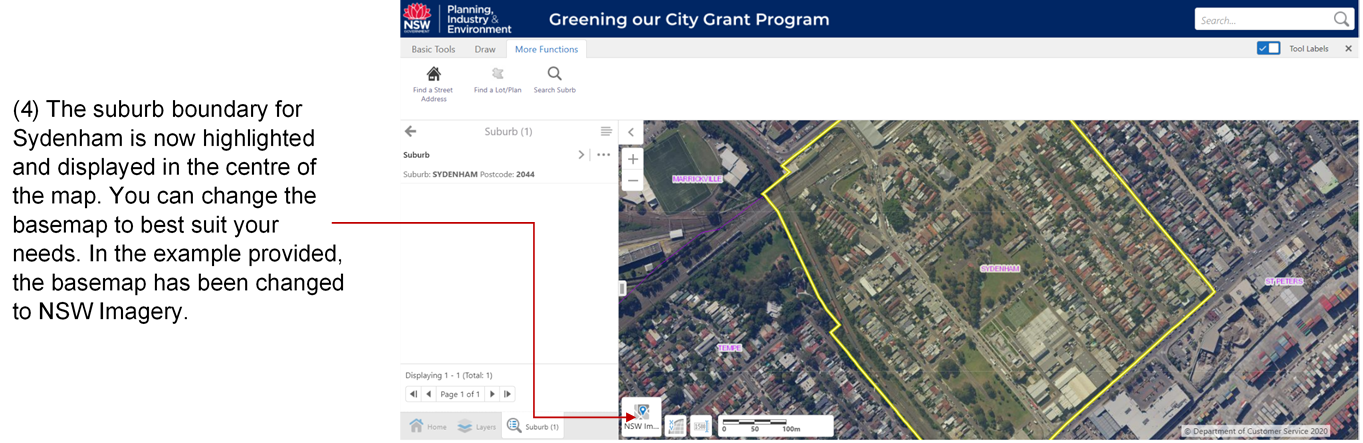
4.4 How do I change the basemap?
There are two ways to change the basemap:
The
simplest ways to change the basemap is by clicking on the basemap icon ![]() at
the bottom left corner of your map screen and select your preferred basemap.
The icon indicates the basemap that you are currently viewing.
at
the bottom left corner of your map screen and select your preferred basemap.
The icon indicates the basemap that you are currently viewing.
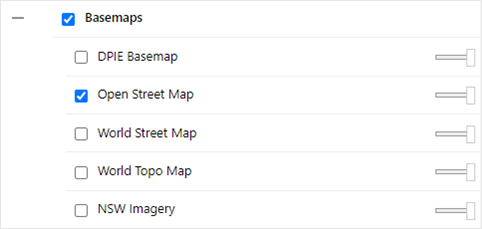
Alternatively
Click on the Layers tab near the bottom left corner of your screen to activate
the Layers panel and scroll down to the ‘Basemaps’ layer group. Click on the ![]() icon to expand the layer
group and turn on the basemap you wish to view by ticking the checkbox
icon to expand the layer
group and turn on the basemap you wish to view by ticking the checkbox ![]() in front of that basemap.
Turn off the basemaps you don’t need by unticking the checkboxes, otherwise you
will not be able to see your preferred basemap if any of the basemaps above it
is still turned on. It is possible to view multiple basemaps by adjusting the
transparency setting of an overlaying basemap using the transparency slider.
in front of that basemap.
Turn off the basemaps you don’t need by unticking the checkboxes, otherwise you
will not be able to see your preferred basemap if any of the basemaps above it
is still turned on. It is possible to view multiple basemaps by adjusting the
transparency setting of an overlaying basemap using the transparency slider.
4.5 Can I add labels to the map?
Yes, you can add your own text to label and annotate any features displayed on your screen, or any features (such as the polygons of your proposed tree planting sites) that you have created. There is an option to add text by click the ‘Text’ button in the Draw menu or using the ‘Add Some Text’ function by right clicking your mouse. It is strongly recommended that your map is clearly labelled and/or annotated, especially if you wish to export the map image as supporting information for your grant application.
4.6 Can I edit my labels on the map?
Yes, you can move, resize or change the properties of any of your labels at any time, but it is not possible to edit the display text once a label has been added. You will have to erase the label and create a new label using the ‘Text’ function in the Draw menu, or by using the ‘Add Some Text’ function by right clicking your mouse.
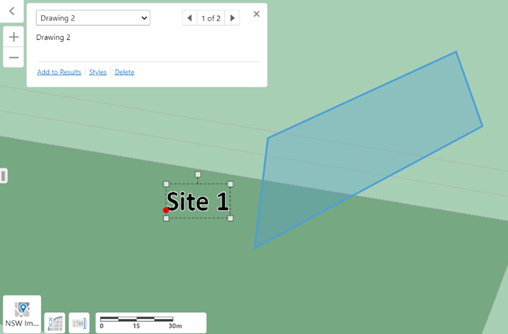
To
edit the properties of a label, hover your mouse cursor over the label and
click on the middle of the label until an edit box appears around the text.
This indicates you are now in editing mode. The Online Spatial Tool considers
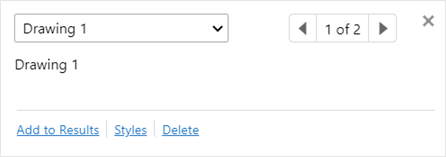
any label that you have created as a drawing (e.g. in the example provided
below, the “Sitel 1” label is identified Drawing 2 while Drawing 1 is the
adjacent polygon). A small properties screen will also appear when your label
has been selected. This properties screen allows you to customise your label
using the ‘Styles’ option, where you can change the font and colour of the
text. While in the editing mode, you can reposition a label by click (centre of
label) and drag in any direction. Use any of the square ![]() vertices
around the edit box to resize your label. Remember to deselect the ‘Edit’
button once the editing is done to get out of editing mode.
vertices
around the edit box to resize your label. Remember to deselect the ‘Edit’
button once the editing is done to get out of editing mode.
4.7 Can I edit my drawings on the map?
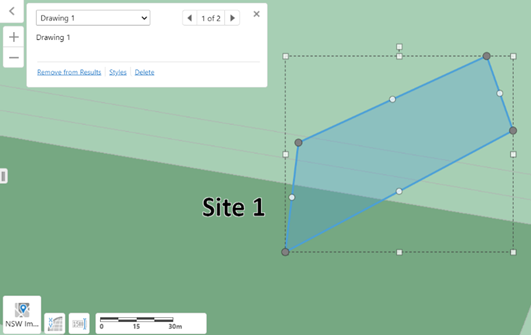
It
is possible to edit any of your drawings. To edit a drawing, hover your mouse
cursor over the drawing and click on the middle of the drawing until an edit
box appears around the text. This indicates you are now in the editing mode. A
small properties screen will also appear when your drawing has been selected.
This properties screen allows you to customise your drawing using the ‘Styles’
option, where you can change the outline and fill properties of your drawing.
While in the editing mode, you can reposition your drawing by click (centre of
the shape) and drag in any direction. Use any of the square vertices ![]() around the edit box to
resize your drawing. Use any of the circular vertices
around the edit box to
resize your drawing. Use any of the circular vertices ![]() or
or
![]() around the actual shape of
your drawing to adjust the shape. There is no option to undo changes. Remember
to deselect the ‘Edit’ button once the editing is done to get out of the
editing mode.
around the actual shape of
your drawing to adjust the shape. There is no option to undo changes. Remember
to deselect the ‘Edit’ button once the editing is done to get out of the
editing mode.
4.8 How do I export drawings of my proposed sites as shapefile?
To export any features (which can be points, lines or shapes) that you have drawn, use the Export Drawings function in the Draw menu. Labels or annotations on a map cannot be individually exported, but they are retained if you export the map as an image. See the Export function under the Basic Tools menu, and FAQ 4.9 for more information.
4.9 How do I export map, together with labels and annotations?
To export a map, together with any labels or annotations that you may have added, use the Export function in the Basic Tools menu. The map can be exported as an image file in a range of formats. We recommend exporting map as GeoTIFF file as it preserves all the essential spatial information, so that the exported map can still be displayed in the correct spatial orientation when viewed at a later date using any GIS software.
4.10 What if my proposed tree planting project is at a scale that is impractical to identify individual sites?
If your proposed tree planting project applies to an extensive area (e.g. specific region(s) within a suburb), or is at a spatial or planning scale where it is impractical to list and identify all (e.g. more than 10) of the individual tree planting sites for the purpose of this application, then you would need to answer the spatial information section of the grant application using sample sites that are representative of the area(s) to which your proposed tree planting will take place. This is with the proviso that the scope and scale of your proposed project is consistent with the grant program guidelines. An example of such project may be suburb-wide street tree planting.
4.11 What if my proposed site has multiple data ranges?
There are questions in the grant application where you are asked to specify the data range for a particular dataset that applies to your proposed tree planting site. It is likely that some of your proposed sites will enclose multiple mesh blocks and therefore have multiple data ranges. Described below are the two scenarios that you are likely to encounter:
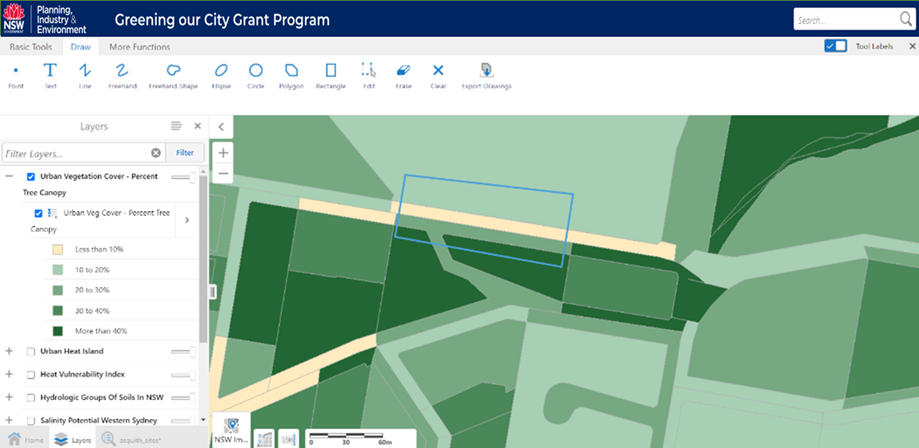
Scenario 1 If your proposed site contains multiple data ranges, nominate the data range that accounts for the majority of the area within your proposed site. In the example provided below, the majority of the area within the boundaries of the proposed site (i.e. inside the blue polygon) has Tree Canopy Cover in the 10-20% range, and this is the data range you would nominate for the question relating to tree canopy cover. In some instances, you may be able circumvent the issue of multiple data ranges simply by adjusting the size and/or shape of your proposed site.
|
|
Scenario 2 If your site contains multiple data ranges, and there are two or more data ranges that of similar prominence, it is possible to calculate the areas for each score using the ‘Measure Area’ function in the Basic Tools menu. In the example provided below, Heat Vulnerability Index scores of 2, 3 and 4 all seem to have similar prominence within the boundaries of the proposed site (i.e. inside the blue polygon).
|
|
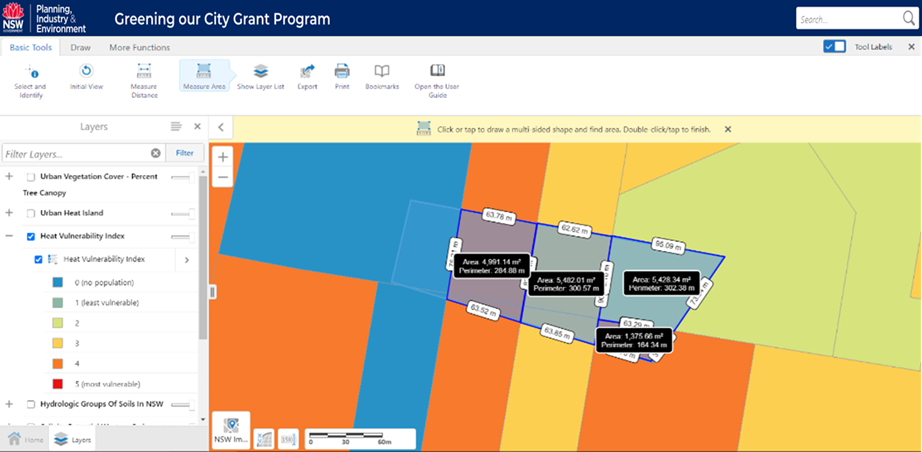
By comparing the area estimates, we can see that Heat Vulnerability Index score of 4 accounts for most of the area within the proposed site.
Area with Heat Vulnerability Index score of 2 = 5428.34 m2
Area with Heat Vulnerability Index score of 3 = 5482.01 m2
Area with Heat Vulnerability Index score of 4 = 4991.19 + 1375.66 = 6366.85m2
Therefore, Heat Vulnerability Index score of 4 is the data range you would select for the question related to Heat Vulnerability (question 5).
However, in situations where you have multiple data ranges with identical or very similar prominence, it is acceptable to simply nominate the mesh block with the data range that best supports the need for proposed tree planting. In many instances, this dilemma may be circumvented by adjusting the size and/or shape of your proposed site.
End of User Guide
Last updated 29/06/2020
Disclaimer
While all material has been created with all due care, the Department does not warrant or represent that the material is free from errors or omission, or that it is exhaustive.
Because the material is designed to promote the free exchange of information only, the Department cannot and does not make any claim as to the accuracy, authenticity, currency, completeness, reliability or suitability of any material, especially material supplied by third parties or linked to third party sites.
The material is provided on the basis that you are responsible for assessing the relevance of its content.
The Department will not accept liability for any loss, damage, cost or expense that you may incur as a result of the use of or reliance upon the material on this site or any linked sites.
Please also note the material may change without notice and you should use the current material from this site and not rely on material previously printed or stored by you.
Bearing in mind the importance of freedom of expression to our democratic society, the NSW Government does not necessarily endorse or support the views, opinions, standards or information expressed at any linked sites. Similarly, you should not interpret the absence of a link from the NSW Government site to any particular third-party site as a criticism or comment by the NSW Government on the provider or content of that site.