department of Planning, industry & environment
 |
Salinity Potential of Western Sydney
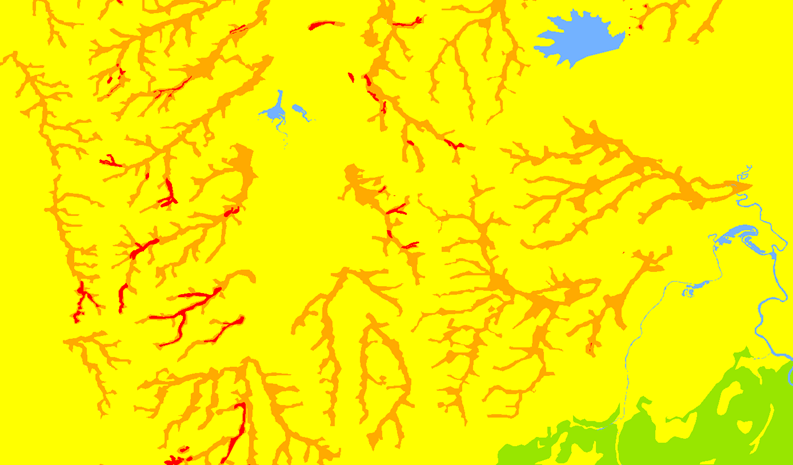
This dataset shows the distribution and potential severity of dryland salinity based on biophysical factors that are known to cause dryland salinity. The mapping shows four classifications of salinity potential: areas of known salinity, areas of high salinity potential, areas of moderate salinity potential, and areas of very low salinity potential.
The dataset provides a spatial indication of the different levels of salinity potential across Western Sydney. Salinity is the accumulation of soluble salts in the soil, groundwater and surface waters. Salinisation is the process where salts stored in the soil profile are mobilised by the movement of water. Subsequent evaporation and accumulation can cause an increase in salt levels to the extent that affect vegetation. In Western Sydney, salinity can be either a soil or groundwater issue that affects the ground surface. The dataset can be used to identify the general level of potential salinity in the locality of a site. It can be used to target areas that favour tree establishment, survival and growth. The information should however only be used at the scale at which it is published (1:100 000) and the viewing of the mapped boundaries of the different levels of salinity potential is not appropriate at the property scale. It is not a substitute for on-site investigation.
The dataset covers the Wianamatta Shales geological group on the Cumberland Plain. This essentially covers the area of Western Sydney, north to Windsor and south to Campbelltown. It includes the areas of Blacktown, Camden, Campbelltown, Fairfield, Holroyd, Liverpool and Penrith, as well as parts of Auburn, Bankstown, Baulkham Hills, Hawkesbury, Parramatta and Wollondilly.
Aerial photographs were used to identify pre-urban development saline sites (i.e. 1965 and 1967). A computer model was used to assess the potential for waterlogging which was then overlayed with the aerial photograph interpretation of saline areas. Extensive field checking and use of expert panel verified mapped results. The data presented is the best available as of August 2002.
|
Field name(s) |
Description of attribute value |
|
|
Potential severity of salinity |
TAG |
Classifications of salinity potential: SALT – area of known salinity HIGH – area of high salinity potential MODERATE – area of moderate salinity potential LOW – area of very low salinity potential WATER – waterway OUTSIDE – unmapped area |
This dataset and the relevant metadata are publicly available on the NSW SEED data portal.
For questions about the dataset, contact the Department of Planning, Industry and Environment
data.broker@environment.nsw.gov.au or 131555
.